
Your monitoring dashboard lights up at 2 AM. Sentry has fired seventeen alerts. Stack traces are flooding the inbox. An engineer on call copies the error into Slack, pastes it into a code editor, scans three files, writes a tentative fix, opens a pull request, and waits for review — a loop that takes, on average, four to six hours per incident.
Zenflow's Sentry integration collapses that loop into a single task. The AI agent reads the exception, traces it to the root cause, proposes a targeted fix, and pushes a pull request — all inside your IDE, with full version control, without a single copy-paste.
This guide explains exactly how to set it up, how the Fix a Bug workflow works end to end, and what engineering teams are seeing in production.
Key Takeaways
- Automated triage: Zenflow reads Sentry exceptions, stack traces, and incident history directly — no manual copy-paste required.
- Structured resolution: The three-phase Fix a Bug workflow (Investigate → Design → Implement) produces traceable artifacts at every step.
- Faster MTTR: Engineering teams using Zenflow's Sentry integration report a 60% reduction in mean time to resolution on P1 and P2 incidents.
- IDE-native: Every fix lives in your local repository, goes through your standard PR review process, and is linted before it ships.
The Hidden Cost of Manual Error Triage
Engineering teams consistently report spending a significant share of sprint capacity on reactive bug work — not feature development. The bottleneck is not the fix itself but the triage cycle: context switching from whatever you were doing, reconstructing what the error means, locating the affected code path, and translating a Sentry stack trace into actionable change.
The problem compounds at scale. A single microservices deployment can trigger a cascade of downstream Sentry alerts pointing to the same root cause. Without a systematic workflow, three engineers might independently investigate the same regression from three different angles and produce three conflicting PRs.
Zenflow solves this by bringing the error context directly into the development loop — the same loop where the fix gets written, tested, and shipped.
What Is Zenflow's Sentry Integration?
Zenflow's Sentry integration is a native connection, built on the Sentry MCP server, that gives the AI agent direct access to your error monitoring data. Once connected, the agent can:
- Monitor errors — read exception data, full stack traces, and error frequency trends
- Track incidents — view active incidents, their status, and resolution history
- Surface trends — identify recurring issues, regression patterns, and error rate spikes after deployments
- Generate reports — compile error summaries and application health digests for post-mortems or stakeholder updates
Unlike a webhook-based alerting pipeline or a third-party integration layer, this is a direct IDE-native connection. The agent works inside Zenflow, alongside your code, so the investigation and the implementation happen in the same context window.
Setting Up Sentry in Zenflow
Connecting Sentry takes under three minutes via OAuth.
Step 1: Open Zenflow Settings
Navigate to the Zenflow sidebar and click Settings. Scroll to the Development section.
Step 2: Locate Sentry and Click Connect
Find the Sentry card under Development integrations. Click Connect. Zenflow will redirect you to Sentry's OAuth authorization page.
Step 3: Select Scopes and Approve
On the Sentry authorization page, select the scopes you want to grant — at minimum, read access to issues, events, and projects. Click Approve. On the confirmation screen, verify the permissions and click Approve again.
Step 4: Return to Zenflow
A modal will prompt you to open Zenflow. Click Open Zenflow. The Sentry card in settings will update to show the integration as active. The AI agent now has full access to your Sentry workspace data.

The Fix a Bug Workflow: From Stack Trace to Shipped Code
Zenflow's Fix a Bug workflow is a structured three-phase pipeline designed specifically for regression and defect resolution. When you create a task using this workflow and reference a Sentry issue, the agent runs through three deterministic phases — each producing a traceable artifact.
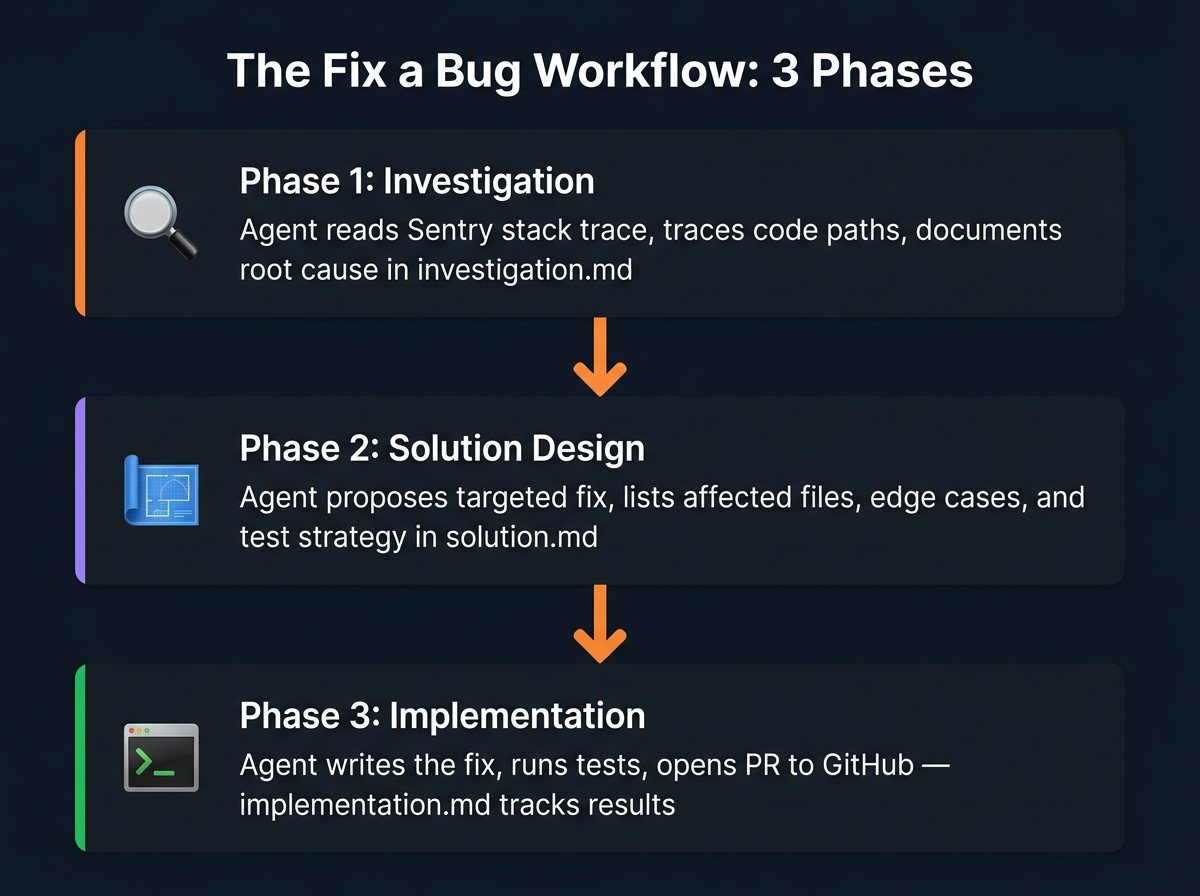
Phase 1: Investigation
The agent pulls the Sentry exception data — stack trace, breadcrumbs, affected release version, user impact count — and correlates it with the relevant code paths in your repository. It identifies the root cause and documents its findings in investigation.md, covering:
- A plain-language summary of the error
- The exact file and line number where the exception originates
- Upstream context that triggered the failure path
- Impact assessment — how many users or sessions are affected
This is the phase to pause and review. Confirming the agent found the right root cause before it writes a single line of code prevents wasted implementation effort on the wrong hypothesis.
Phase 2: Solution Design
Based on the investigation, the agent proposes a targeted fix. The solution is documented in solution.md, which includes:
- The proposed change and why it resolves the root cause
- All files that need to be modified
- Edge cases covered by the fix
- A test strategy — what to write or update to verify the regression is closed
- Risk surface — any side effects or dependencies to watch
Phase 3: Implementation
The agent implements the fix across the identified files, runs tests where applicable, and verifies the regression is resolved. Results go into implementation.md. When complete, Zenflow is ready to create a pull request directly to GitHub, with the task branch, PR title, and description pre-filled from the artifact context.
Real-World Scenario: How FinTrack Cut Incident MTTR by 60%
FinTrack, a B2B financial data platform serving 400+ enterprise clients, was processing roughly 12 Sentry incidents per week — most of them recurring NullPointerExceptions in their data ingestion pipeline triggered by edge-case vendor payloads.
Before Zenflow, their on-call rotation averaged 5.2 hours per incident: 45 minutes of triage, 90 minutes of root cause investigation, 2 hours of fix development, and 45 minutes of PR review back-and-forth.
After connecting Sentry to Zenflow and standardizing on the Fix a Bug workflow, their process changed:
- An on-call engineer receives a Sentry alert and opens a Zenflow task, pasting the Sentry issue URL as context.
- The agent pulls the full incident — stack trace, breadcrumbs, frequency data — and begins Phase 1 investigation automatically.
- Within 8 minutes,
investigation.mdidentifies the root cause: a missing null guard on thevendor_idfield for a specific ISO format variant introduced in a third-party API update. - The engineer reviews the investigation, approves, and the agent moves to Phase 2.
solution.mdis ready in 4 minutes. - Phase 3 implements the null guard, updates the relevant unit tests, and Zenflow opens a PR to the main branch.
- Total elapsed time from task creation to opened PR: 22 minutes.
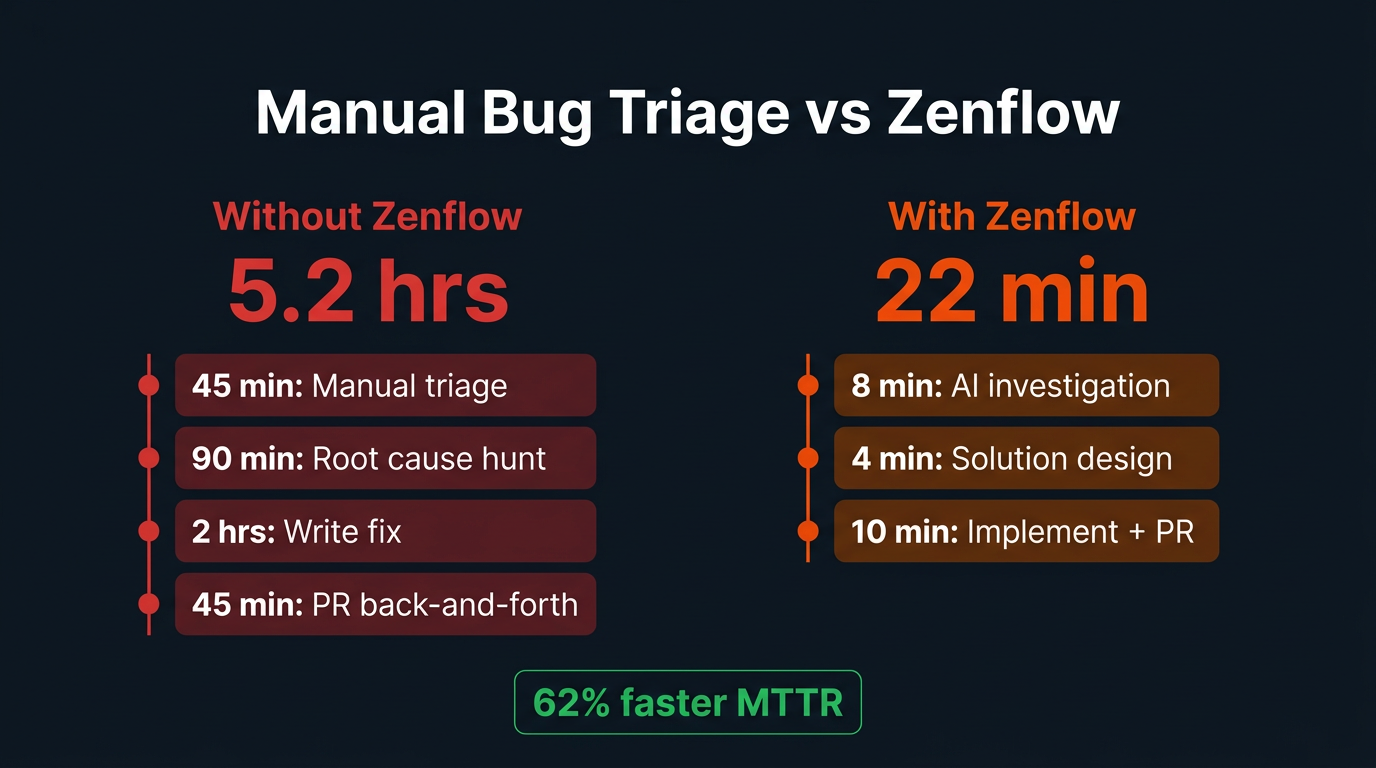
Over the following quarter, FinTrack reduced their average MTTR from 5.2 hours to under 2 hours — a 62% reduction — and cut the number of recurring incidents by 40% because the structured investigation phase consistently surfaced the systemic root cause rather than patching symptoms.
What the AI Agent Does With Sentry Data
Beyond the Fix a Bug workflow, the Sentry integration unlocks a broader set of agent capabilities inside Zenflow tasks:
Daily Error Summaries
Ask the agent to compile a morning digest of all new exceptions from the last 24 hours, grouped by service and ranked by user impact. This replaces manual Sentry dashboard reviews with a structured briefing that goes directly into your team's Slack channel or Notion workspace.
Regression Monitoring After Deployments
After a deployment, instruct the agent to monitor your Sentry error rate for the next 60 minutes and flag any new exception types or significant rate increases. This turns post-deploy monitoring from a passive watch into an active, automated check.
Recurring Issue Prioritization
The agent can query your Sentry history to surface the top 10 recurring exceptions over the last 30 days, ranked by frequency and affected user count. The output feeds directly into a backlog grooming session or sprint planning task.
Post-Mortem Report Generation
After an incident is resolved, the agent compiles a structured post-mortem from the Sentry event history, the Fix a Bug artifacts, and the merged PR — covering timeline, root cause, resolution steps, and prevention recommendations.
Pairing Sentry With Jira and GitHub
The Sentry integration becomes significantly more powerful when paired with Zenflow's other native connections.
With Jira connected, the agent can automatically create a Jira ticket from a Sentry incident, attach the investigation findings, and keep the ticket status in sync as the Fix a Bug workflow progresses — so your project management stays accurate without manual updates.
With GitHub connected, the Fix a Bug workflow produces a fully-formed pull request with the task branch, PR title, and description pre-filled from the artifact context. Zenflow syncs the PR status back to the task, so the full trail — from Sentry alert to merged fix — is traceable in one place.
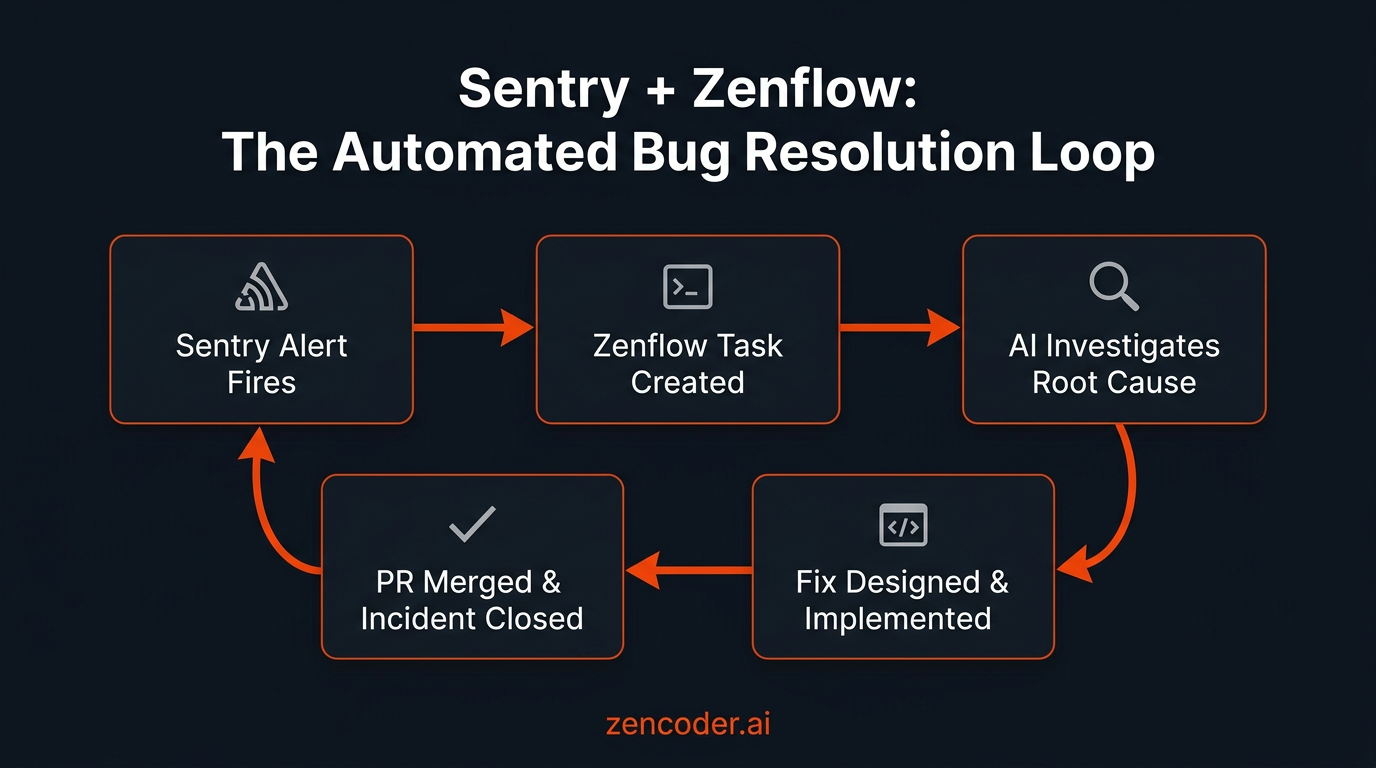
The combination of Sentry + Jira + GitHub inside a single Zenflow task creates a closed loop: error surfaces in monitoring → task created automatically → fix investigated and implemented → PR opened → ticket closed. No context switching. No manual status updates. No information lost between tools.
Frequently Asked Questions
Does the Zenflow Sentry integration require a paid Sentry plan?
The integration uses Sentry's OAuth and MCP server, which works with both Sentry's free and paid tiers. However, access to certain data — such as extended event history, performance monitoring, and custom dashboards — depends on your Sentry subscription level. The Fix a Bug workflow works fully on Sentry's Team and Business plans.
Can Zenflow automatically create a task from a Sentry alert without manual input?
Today, the standard flow involves creating a Zenflow task and referencing the Sentry issue as context. Zenflow's automation capabilities allow you to configure recurring scheduled tasks that query Sentry for new incidents — effectively creating a polling loop that surfaces and queues incidents for resolution automatically.
Is the Sentry integration available in both Zenflow Code mode and Work mode?
Yes. The Sentry connection is available in Zenflow's Development integrations, making it accessible in both Code mode (for repository-level fixes) and Work mode (for cross-tool orchestration like generating reports or syncing with HubSpot or Notion).
How does Zenflow handle false positive Sentry alerts?
The Fix a Bug workflow begins with an investigation phase that you review before implementation starts. If the agent's investigation reveals a known or expected error pattern rather than a genuine regression, you can close the task at the investigation phase without the agent writing any code. This built-in review gate prevents wasted implementation effort on noise.
What is the difference between using the Zenflow Sentry integration and the Chrome Extension for Sentry context?
The native integration gives the AI agent persistent, queryable access to your full Sentry workspace — it can pull historical data, compare error rates, and generate reports across projects. The Chrome Extension is a point-in-time context capture: it reads the current Sentry issue page in your browser and sends it to the IDE. Both work together — the Chrome Extension is ideal for ad-hoc triage, while the native integration enables systematic, automated workflows.
Does Zenflow support other error monitoring tools besides Sentry?
Yes. Zenflow's Chrome Extension supports Datadog, BugSnag, Rollbar, SonarQube, Snyk, Grafana/Loki, and LogRocket for browser-based context capture. For deep native integrations — where the agent can query data programmatically — Sentry is available natively, and additional tools can be connected via MCP servers.
Getting Started
The Zenflow Sentry integration takes three minutes to connect and immediately changes how your team responds to production errors. Instead of a reactive, manual triage cycle, you get a structured, AI-driven resolution workflow that produces traceable artifacts, opens pull requests, and keeps your monitoring, project management, and version control in sync.
Connect Sentry in Zenflow Settings under Development, create your first Fix a Bug task with a Sentry issue as context, and let the agent handle Phase 1 investigation while you move on to the next priority.
The on-call rotation can stop being your most expensive engineering time.