Zenflow for Engineering Managers
Your DORA dashboard is already in Zenflow
Cycle time, deployment frequency, and investment allocation on one live dashboard, built by a Zenflow skill from the repos and trackers you already use.
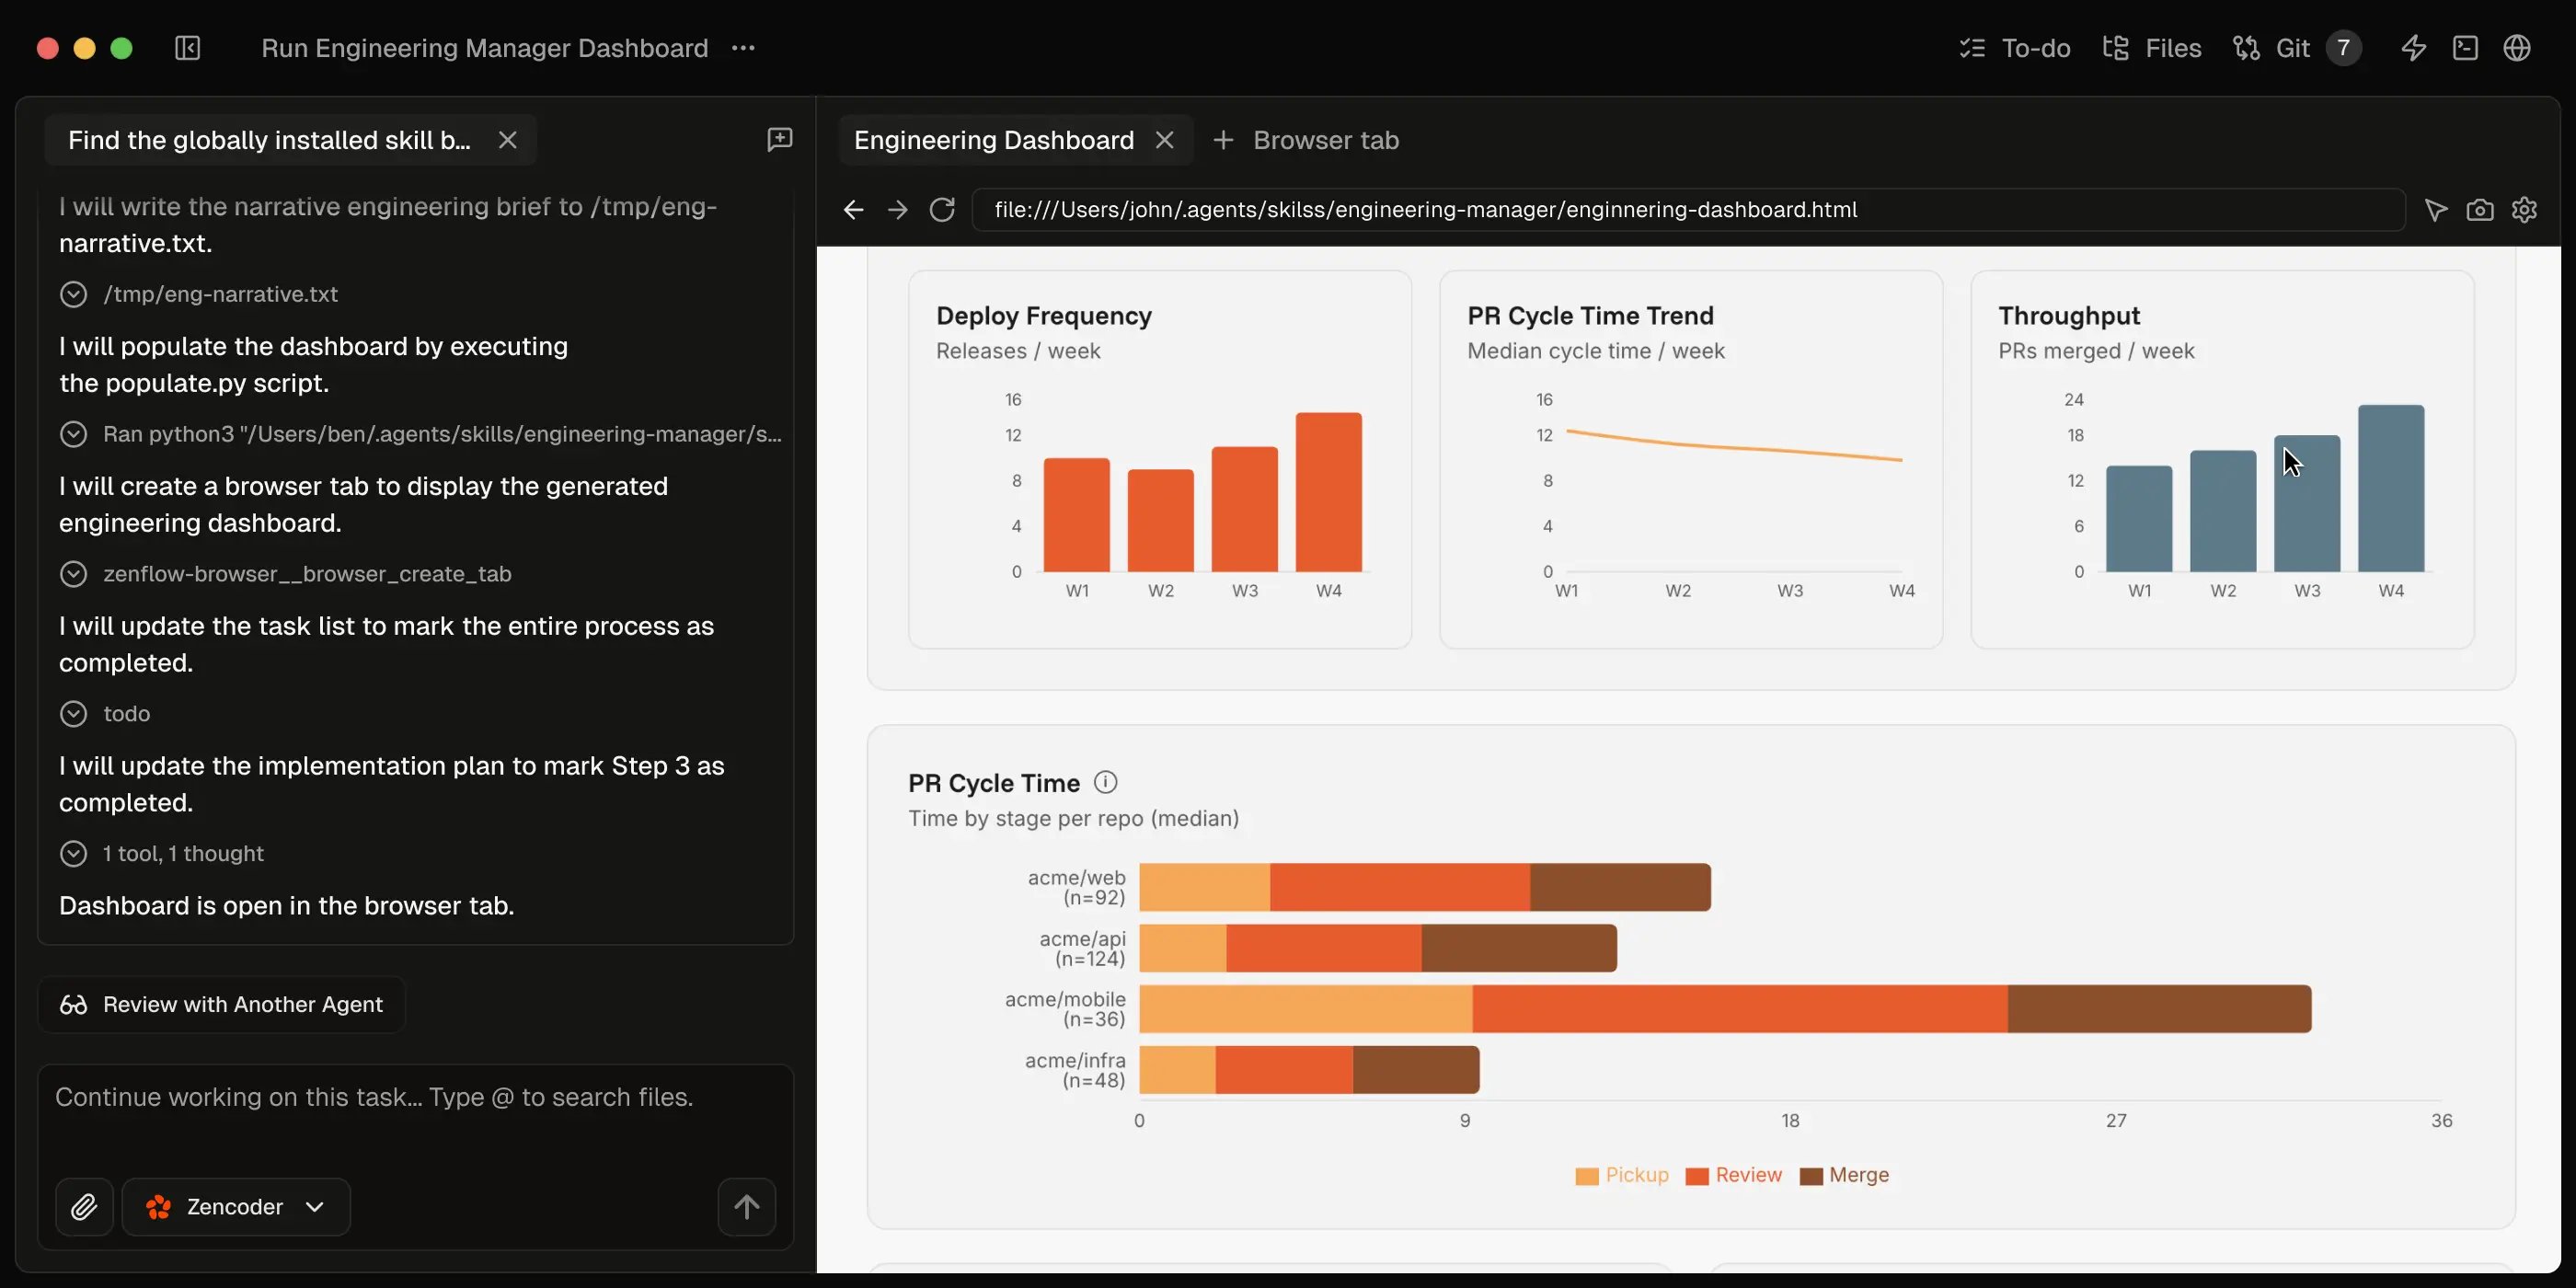
Watch it build a dashboard from real repos
One trigger. The skill gathers metrics across your repos and renders the full dashboard, start to finish.
What you get
Four views into how your team is really doing
Every metric is team-level. The dashboard never reports on individuals.
DORA metrics, live and team-level
The full DORA set plus cycle time, velocity, and investment allocation, refreshed on a schedule.
Cycle Time
The time from PR creation to merge. It surfaces where work stalls: idle reviews, prototypes left open, PRs that never close.
Investment Allocation
Engineering effort sorted by issue type. Shows where the team's focus actually goes, and whether new features and bug work stay in balance.
Deployment Frequency
How often your code reaches production. The clearest signal of team velocity.
Setup
From install to live dashboard
Four steps, and the skill handles most of them.
Check prerequisites
Python 3 and the GitHub CLI, authenticated against your org. Most engineering machinesalready have both.
One time
Enable the skill
In Zenflow, open Automations -> Engineering and use the Engineering Manager Dashboard template. It installs and schedules itself.
30 SECONDS
Let it find your repos
The skill discovers repos from your Zenflow projects. Set them explicitly inorg-config.yaml if you'd rather. Missing integrations show as locked panels, nothing breaks.
AUTOMATIC
Read your dashboard
A single page, refreshed on schedule. DORA metrics, cycle time, velocity, and investmentallocation, current every time you open it.
ONGOING
Put your team's metrics on autopilot
Enable the Engineering Manager Dashboard in Zenflow and get your first dashboard today.
Webinar
The $100K analytics stack you don't need
Engineering teams pay six figures a year for analytics tools. Most of that data already sits in the AI platform your engineers use daily.
Frequently asked questions
-
The four DORA metrics are deployment frequency, lead time for changes, change failure rate, and mean time to recovery (MTTR). Together they measure how fast and how reliably a software team ships. The Zenflow engineering manager dashboard tracks all four automatically, with 1-week, 4-week, and 12-week trends.
-
DORA performance is graded on four tiers: elite, high, medium, and low. An elite team deploys on demand, ships changes in under a day, and recovers from incidents in under an hour. The dashboard rates each of your four metrics against these tiers, so you can see where your team lands without interpreting the raw numbers yourself.
-
PR cycle time is the total time a pull request takes from open to merge, broken into three stages: pickup time, review time, and merge time. The dashboard reports the median for each stage, per repo, across your most recently merged PRs, so you can see exactly where pull requests stall.
-
Sprint velocity compares the work a team committed to in a cycle against what it actually delivered. The dashboard calculates it cycle over cycle using Linear cycles or Jira sprints, and falls back to a rolling weekly window when neither is connected, so velocity tracking works regardless of your setup.
-
It still works. Sprint velocity falls back to a rolling weekly window when no cycle tool is connected. Any metric that needs an integration you don't have shows as a locked panel with a prompt to connect it. The rest of the dashboard renders normally.
-
The skill runs on a schedule and refreshes the dashboard each time. You can also trigger it on demand with a prompt like "engineering dashboard" or "DORA metrics" whenever you want the latest read.